Short answer: Audience growth does not guarantee revenue growth when each new viewer earns less. To see the real picture, media businesses need to track yield alongside reach: revenue per user (ARPU), CPM and fill rate, customer lifetime value against acquisition cost (LTV:CAC), and how much digital revenue replaces each dollar of linear revenue lost.
We built a sample commercial performance dashboard for a fictional New Zealand media company with linear channels, a streaming app, a news site and off-platform video. The data is illustrative. The problem it shows is one many broadcasters and publishers will recognise.
The headline: more viewers, less value
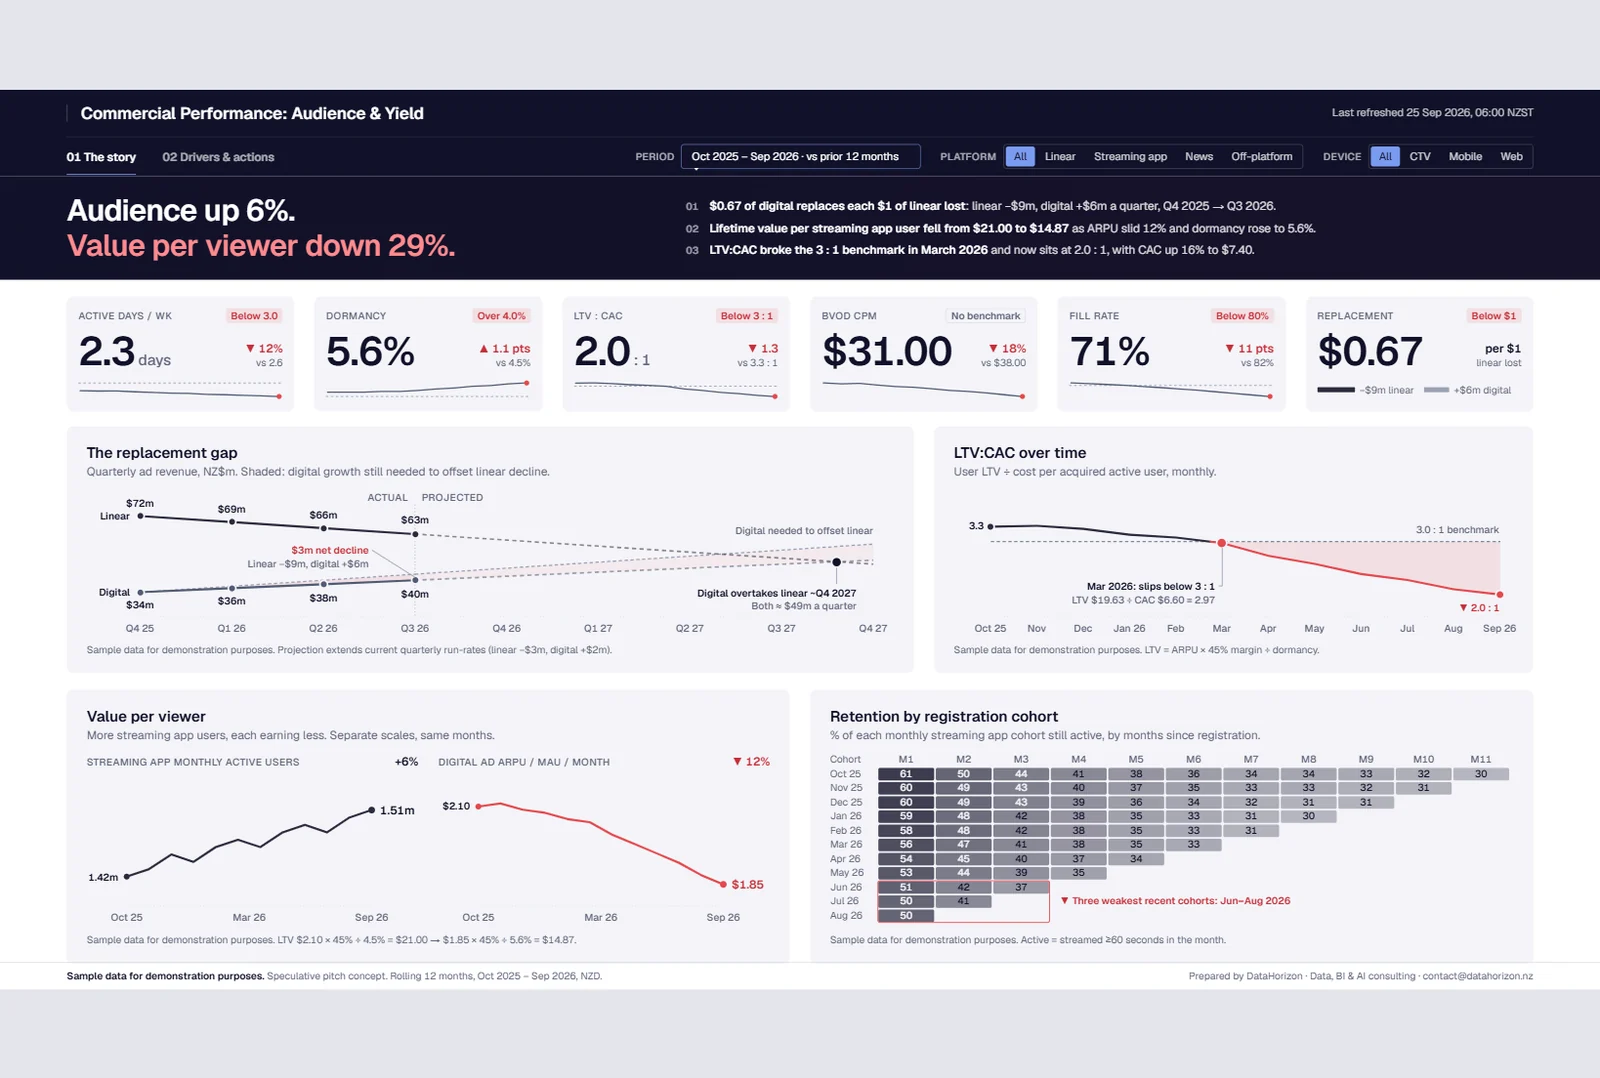
Over 12 months, streaming app monthly active users grew 6%, from 1.42 million to 1.51 million. Over the same period, digital ad revenue per user fell 12%, from $2.10 to $1.85 a month.
Fewer of those users stayed active, too. Monthly dormancy rose from 4.5% to 5.6%, and active days per week fell from 2.6 to 2.3. Put together, the lifetime value of each streaming user fell from $21.00 to $14.87, a 29% drop.
A reach-only report would call this a good year. A yield view shows the business is working harder for less.
The digital replacement ratio
The digital replacement ratio is the digital revenue gained for every dollar of linear revenue lost over the same period. Calculate it as digital revenue gained ÷ linear revenue lost.
In the sample, quarterly linear ad revenue fell from $72m to $63m, a $9m drop. Digital rose from $34m to $40m, a $6m gain. That is a ratio of $0.67: each dollar lost on linear is replaced by 67 cents of digital.
Below $1, the business is shrinking even while digital grows. At current run-rates, digital only overtakes linear around Q4 2027, when both sit near $49m a quarter. The shaded gap between the two lines is the growth digital still has to find.
LTV:CAC: is growth paying for itself?
LTV:CAC compares what a user is worth over their lifetime with what it cost to acquire them. A common benchmark is 3:1.
In this sample, user LTV is calculated as ARPU × 45% contribution margin ÷ monthly dormancy. CAC is acquisition spend ÷ new registrants active within 30 days.
The ratio started the period at 3.3:1. It slipped below the 3:1 benchmark in March 2026 (LTV $19.63 ÷ CAC $6.60 = 2.97) and now sits at 2.0:1. Two things drove it: LTV fell as ARPU slid and dormancy rose, and CAC climbed 16% to $7.40.
The cohort table shows the retention side clearly. The October 2025 cohort kept 61% of users active in their first month. The June to August 2026 cohorts kept only 50–51%, the weakest of the year.
Not every channel is equal: yield vs reach
Plotting each channel’s reach growth against its CPM splits the portfolio into four groups.
| Channel | Reach share | Yield (CPM) | YoY reach | Position |
|---|---|---|---|---|
| Streaming app, connected TV | 21% | $36 | +14% | Growing and monetising |
| Streaming app, mobile and web | 13% | $22 | +3% | Growing, mid yield |
| Channel 1 (linear) | 29% | $24 | −9% | Declining, still valuable |
| Channel 2 (linear) | 16% | $19 | −14% | Declining, low yield |
| News digital | 11% | $18 | −4% | Declining, low yield |
| Channel 3 (linear) | 5% | $15 | −11% | Declining, low yield |
| YouTube and social | 5% | $4 | +27% | Growing, low value |
Connected TV is the only channel that combines growth with premium yield. YouTube and social grow fastest, but at a $4 CPM they add reach far more than revenue.
CPM (cost per thousand impressions) is ad revenue per 1,000 impressions. Fill rate is sold impressions ÷ available impressions. In the sample, streaming BVOD CPM fell 18% from $38 to $31, and fill rate fell from 82% to 71%, below the 80% benchmark since February 2026. Price and volume are falling together.
Content ROI: the numbers ad revenue can’t see
Dividing ad revenue by cost per content hour shows which genres pay for themselves. Acquired international content returns 2.33× its cost, local reality 1.39× and news 1.26×. Live sport sits at 0.94× and local drama at 0.63×, both below breakeven.
That does not mean cutting local drama. It carries public-media value, New Zealand stories and identity, and reach that ad ROI does not capture. A good dashboard shows that trade-off openly, so it is a decision, not an accident.
Three moves back to 3:1
The dashboard ends with costed actions. Each is modelled from the same formulas, so the board can see the arithmetic.
- Retention: cut dormancy to 4.5%. LTV rises to $1.85 × 45% ÷ 4.5% = $18.50, lifting LTV:CAC to 2.5:1.
- Acquisition: shift 10% of spend to connected TV prompts. Assuming CTV acquires users at half the cost, blended CAC falls to $6.73, lifting LTV:CAC to 2.2:1.
- Yield: lift fill rate to 80% with programmatic guaranteed deals. ARPU rises to $2.08 at a $31 CPM, adding about $4.2m a year ($0.23 × 1.51m users × 12 months).
Combined, LTV reaches $2.08 × 45% ÷ 4.5% = $20.80. Against CAC of $6.73, that is 3.1:1, back above the benchmark.
What media leaders should take from this
- Report yield next to reach. Audience numbers alone can hide a falling business.
- Track the replacement ratio quarterly. Below $1 means digital is not yet filling the linear gap.
- Watch LTV:CAC by cohort. Recent cohorts warn you months before the total moves.
- Show the formulas. When the board can see the arithmetic, actions get approved faster.
Want this view of your audience and revenue?
DataHorizon builds data, BI and AI solutions for New Zealand businesses, including commercial dashboards that connect audience, yield and retention in one place. If your reporting tells you reach is up but cannot explain why revenue is not, get in touch. Learn more about our Advanced BI & Semantic Modeling service.
Frequently asked questions
Why is audience growing but revenue falling?
Usually because each viewer earns less. Revenue per user can fall when CPMs drop, fill rates slip, viewers move to lower-yield platforms or users become less active. Tracking yield alongside reach shows which of these is happening.
What is the digital replacement ratio?
It is the digital revenue gained for every dollar of linear revenue lost over the same period. A ratio below $1 means digital growth is not yet making up for linear decline, so total revenue is shrinking.
What is a good LTV:CAC ratio for a streaming service?
A common benchmark is 3:1, meaning a user is worth three times what it cost to acquire them. Below that, growth may cost more than it returns over time.
How do you calculate customer lifetime value for an ad-funded streaming app?
One simple method is ARPU × contribution margin ÷ monthly dormancy rate. For example, $1.85 monthly ARPU × 45% margin ÷ 5.6% dormancy gives an LTV of about $14.87.
What is BVOD CPM?
BVOD stands for broadcaster video on demand. BVOD CPM is the digital video ad revenue earned per 1,000 impressions on a broadcaster’s streaming platform.
What is ad fill rate?
Fill rate is the share of available ad impressions that are actually sold. It is calculated as sold impressions ÷ available impressions. Falling fill means unsold inventory and lost revenue, even if audience is stable.
See also: Where the network is losing time: the freight KPIs NZ operations teams should track.